April 2013 market update
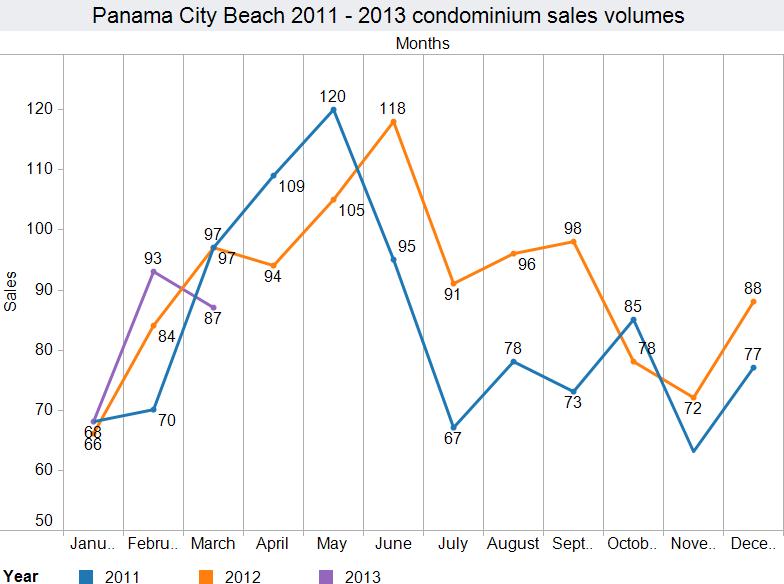
 Condo sales volume in Panama City Beach is starting off the year fairly inline with recent year statistics, which is demonstrated by the graph seen below. This is interesting because inventory in a number of buildings and floor plans is rapidly shrinking. It appears that some buildings are selling quickly while others are not seeing many transactions, thereby leading to overall sales volumes that are average. The second graph below shows the historical average quarterly price per square foot of all two bedroom gulf-front condominiums.
Click on image below to see the full size graph
Historical look at the per square foot price of two bedroom condos built after 2000
Click on image below to see the full size graph
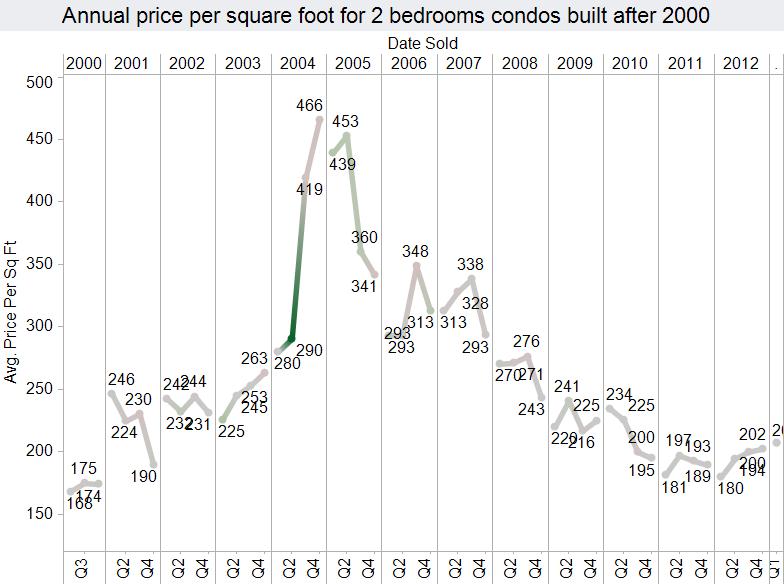
This graph paints a pretty clear picture of the real estate market pre- and post- boom. It looks like the prices for Panama City Beach condos for sale bottomed out around $180 per square foot during the first quarters of 2011 and 2012.
Click on image below to see the full size graph
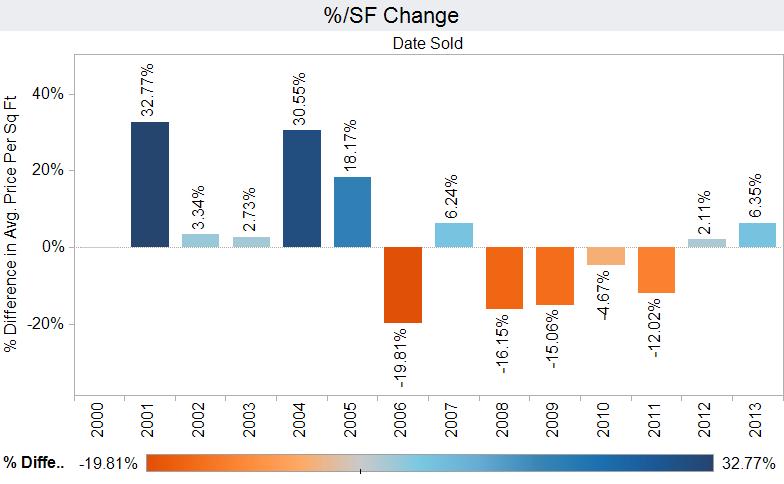
While different buildings and floor plans will hit the bottom of the market at different prices, this graph paints a good overall picture of average prices over time. The first quarter of 2013 saw pricing at $207 per square foot. There was an overall increase of 2.11 percent in 2012 and another price increase of 6.35 percent for sales already booked in 2013.
As competitively-priced inventory becomes more scarce, there will be additional upward pricing pressure going forward. This means that many units currently priced well above market and not receiving any activity will become increasingly attractive. It appears that the new found stability in the market may have created a new normal.
- Created on .
- Last updated on .
- Hits: 5787