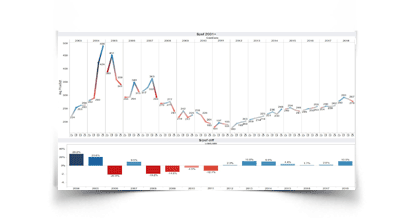
Here is a sales history of Splash Condominium in Panama City Beach, Florida. The graphs included are: The first outlines the complete history, and the second depicts Splash sales from 2009 to the present. The third shows the percentage difference from the prior year. Together, these graphs provide a clear picture of the price differentials over time.
With only two months remaining in 2018 condo sales prices are up 10% year to date. Sales volume is up 12% compared to the same period last year. Fourth quarter sales volume is going to be significantly impacted by Hurricane Michael. This will be covered in further detail later. The majority of supply is being provided by preconstruction owners who have still not seen prices fully recover. We are seeing demand from people who want to own condos in Panama City Beach. While buyers are paying attention to the numbers, we have not seen speculators buying Panama City Beach gulf front condos. We can attribute this to strict lending standards preventing noncredit worthy buyers from entering the market. This is providing a balanced market free of outside influences.
After a 10% increase in 2018, we are up 3% so far this year. Sales volume is down 40% compared to the same period last year. Preconstruction owners made up much of our inventory supply for years. This supply is quickly diminishing and returning us to sustainable sales volumes. Strict lending standards are keeping our condo market free from outside influences.
Following an increase of 10% in 2018, we are already up by 6.9% in 2019. Compared to the same period last year, the sales volume is down by 21%, but still higher than we expected. Since 2011, we have been able to see a healthy balance with our sales volume performance. I am not seeing any signs of what would be considered as a ‘real’ pre-construction supply. As such, sales price increases and a steady volume all reflect the fact that Panama City Beach is continuing to improve, mature, and grow as a vacation destination.

