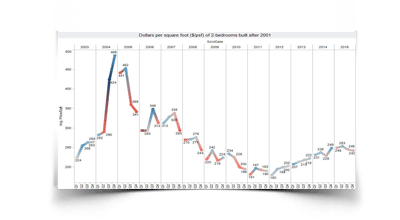
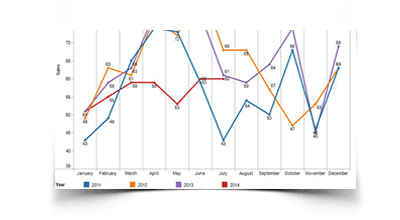
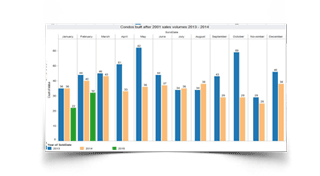
Condominium prices have increased 5.6 percent this year. That is down from the 6.1 percent we were up in the June Market Update. It is not that prices have fallen, but that the majority of condos selling are of floor plans that bring a lower per square foot price. For example: A 2-bedroom floor plan with both bedrooms off the water is going to sell for considerably less than a 2-bedroom with a master bedroom on the water.
Condos see third year of price increases
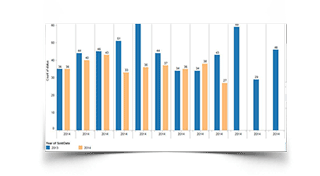
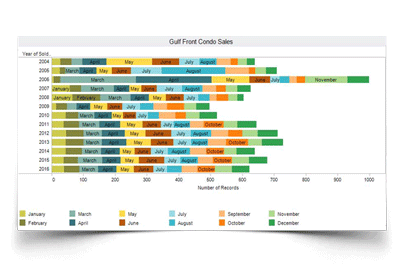
In 2012 condos showed promising signs of prices beginning to bounce back. In 2013 condo sales prices clearly showed the market had rebounded. What was interesting about 2013 was that even after two years of price increases, the sales volumes didn't fall off. The reason for this was that inventory was running low on some of the floor plans at their current pricing levels. Meanwhile other floorplans that had not seen absorption for years were beginning to pick up the slack. The lack of inventory really became apparent in 2014. Even though we had price increases of 10% in both 2013 and 2014, our sales volumes were off by 21% when compared to the previous two years. I expect this trend to continue in 2015.
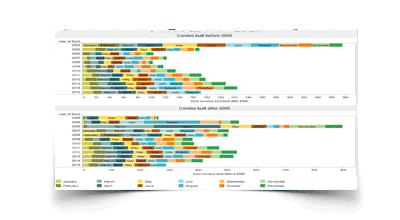
In 2015, we saw the prices of condominiums increase for the fourth consecutive year. Even as prices rose, sales volumes remained strong. The vast number of sales were condos built since 2000, but there was a continued increase in annual sales volumes for older units because of the price increases on newer condos.
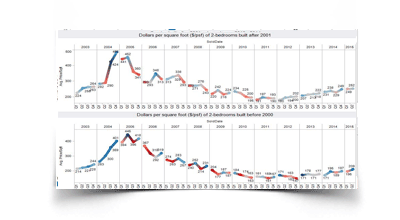
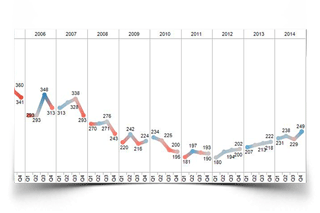
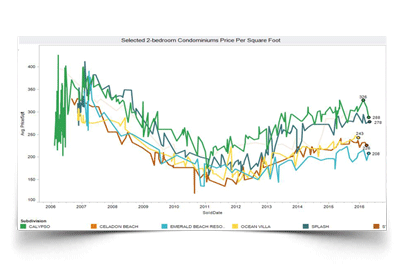
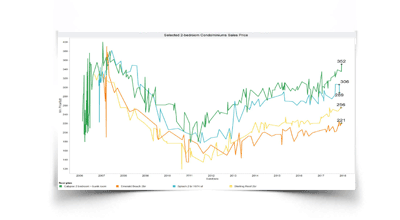
We noticed over the year that most of the condos that sold have floor plans that bring a lower price per square foot. For instance, a two-bedroom floor plan in which the bedrooms are not located on the water will sell for considerably less than a two-bedroom floor plan in which the master bedroom is positioned on the water. Below are several graphs that demonstrate the trend that we are seeing.
The average 2016 sales prices for most condominium floor plans are continuing to increase, though they are doing so at a much slower rate than in prior years. But not all condominiums have seen price increases this first quarter. Some condos are experiencing decreasing average sales prices and a few that have yet to see a sale this year.
Our sales volumes are also down 10% compared to the 2015 January through April time period. It is important to note the current pricing levels we are seeing in many buildings. If you look at many of the condominium preconstruction prices, deduct the 20% down payment, deduct closing costs and ignore all of the upkeep costs, this is roughly the same price at which the majority of condos are selling.
After three consecutive years of price increases (2013 - 10.6%, 2014 10.4%, and 2015 7%), the fourth year failed to materialize. 2016 is a mixed year for condo sales prices in Panama City Beach. On average the sales prices are down 1.8% this year. Buildings and floor plans individually have been a mixed bag.
A look back at 2016 condo sales in Panama City Beach
The 2016 Panama City Beach condo market was a bit of a mixed bag. The average sales price per square foot for condos built in the area after 2001 are down less than 1% from last year. This year saw some floor plans increase in price while others were flat or fell lower. There is still a healthy demand for condos as the area continues to improve and mature. Strict financing requirements are providing a healthy market free from speculators and flippers.
A Look Back At 2017 Condo Sales In Panama City Beach
2017 was a very healthy year for the Panama City Beach condo market. Sales volume was the biggest surprise with an increase of 40% year over year. An interesting phenomenon this year was a buyer finding their perfect condo, struggling to agree with the seller on a contract price, and watching it sell shortly after. Many buyers who did find their ideal condominium were pleasantly surprised later in the year. Several preferred floor plans had significant price increases this year, or have no available inventory. Strict financing requirements are still keeping speculators and flippers from entering this market.
The trend of dropping sales volumes that we were focused on in June 2014 took a pause in July. We have noticed that our sales volume has decreased by 19% over what it was in 2013 as well as a 19% decrease for the same time period in 2012. From January through July of 2014, we have sold 397 gulf front condominiums. That is compared to the sale of 475 condominiums during the same time period in 2013 as well as 476 condominiums in 2012. We are entering a new market where we see the volume of sales for 2014 has declined. Inventory has become scarce as pricing increases over that of a year ago. Are condos selling? Yes they are, just at a slower pace.
Unsurprisingly, 2015 has been off to a slow start for selling condominiums. Today, sellers are demanding for higher sale prices on their condo listings. This in turn is resulting in few buyers who are willing to spend those prices. With no supply of distressed sales, this is the new real estate market in Panama City Beach. Foreclosures and short sales rarely happen anymore and when they do reach the market, these properties are sold at the retail price.
With only two months remaining in 2018 condo sales prices are up 10% year to date. Sales volume is up 12% compared to the same period last year. Fourth quarter sales volume is going to be significantly impacted by Hurricane Michael. This will be covered in further detail later. The majority of supply is being provided by preconstruction owners who have still not seen prices fully recover. We are seeing demand from people who want to own condos in Panama City Beach. While buyers are paying attention to the numbers, we have not seen speculators buying Panama City Beach gulf front condos. We can attribute this to strict lending standards preventing noncredit worthy buyers from entering the market. This is providing a balanced market free of outside influences.
After a 10% increase in 2018, we are up 3% so far this year. Sales volume is down 40% compared to the same period last year. Preconstruction owners made up much of our inventory supply for years. This supply is quickly diminishing and returning us to sustainable sales volumes. Strict lending standards are keeping our condo market free from outside influences.
Following an increase of 10% in 2018, we are already up by 6.9% in 2019. Compared to the same period last year, the sales volume is down by 21%, but still higher than we expected. Since 2011, we have been able to see a healthy balance with our sales volume performance. I am not seeing any signs of what would be considered as a ‘real’ pre-construction supply. As such, sales price increases and a steady volume all reflect the fact that Panama City Beach is continuing to improve, mature, and grow as a vacation destination.
Condo pricing is 1.9% lower for the year. Even with Covid, the condo market is holding its own. A decade of strict lending requirements created a market of financially sound owners. Panama City Beach will navigate 2020 with ease, but don’t expect average values to be significantly higher this year.
Market Crash, Correction, or Stability?
A Few Buildings Have Crashed
Market downturns are characterized by a significant decline in property values, often exceeding a 20% drop from peak prices within a year. In Panama City Beach, a handful of condominium buildings have experienced such downturns, primarily because of a series of questionable decisions made by their associations in previous years that are now impacting those particular properties. The Shores of Panama stands out as a notable example, with several articles highlighting ongoing issues for over five years.
Market Crash, Correction, or Stability?
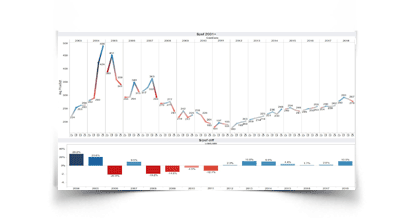
Some buildings and floor plans have remained stable, showing no signs of pricing stress or reduction. Other buildings are experiencing a significant price drop, with values falling back to 2021 levels. The average price per square foot tries to balance a very segmented market, but it can be misleading. Here are a few examples:
Sales volume plummeted beginning in February 2024, leading to the onset of significant price drops by July. From the second to the fourth quarter, prices fell by 15%. The average yearly drop of 5% from 2023 to 2024 doesn't fully capture the depth of these price falls. Rental income decreased, while many associations saw a notable rise in condominium budget costs in 2024. In 2025 many associations are once again budgeted for higher overall expenses. Many buildings costs were partially offset in 2024 by a considerable reduction in insurance rates. Although insurance costs remain much higher than they were five years ago, they were lower than many associations had anticipated in their 2024 budgets.
Sales volume this year is off to an even slower start than last year’s historic low, lagging an additional 31% below 2024. Despite this, average prices are holding steady. It’s still too soon to determine if this signals a broader trend. Similarly, while it’s premature to predict rental performance for 2025, there’s no indication of improvement compared to last year. Many associations have budgeted for increased overall expenses in 2025. Rising building costs were somewhat mitigated by a significant drop in insurance rates. Though insurance costs remain well above levels from five years ago, they are coming in lower than many associations had expected when planning their 2025 budgets.

